
Aerial
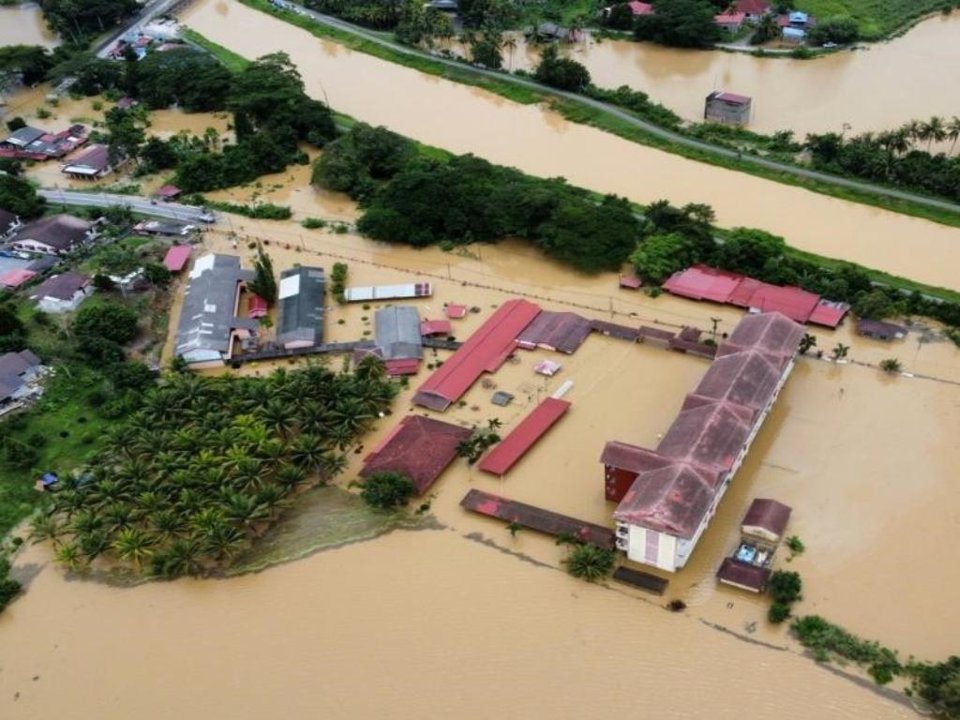
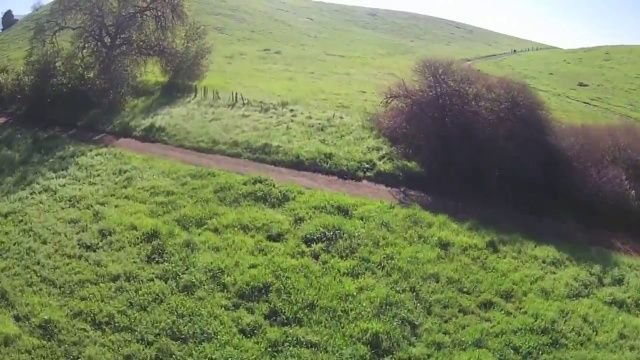
Drone and helicopter photos, taken at an angle.
Built at Accelerant
TideWatch reads a photo taken from the air or a satellite tile and says whether the area in it is flooded, with the probability behind the answer. It is a research preview, built to see how far a large vision model can go on catastrophe imagery.
Runs inside Accelerant’s environment. Images are scored and never stored.
AIFloodSense, CC BY 4.0 · aerial model
Answer
FloodedProbability
>99.9%The probability that the area is flooded. Above 50%, the answer is flooded.
Two views, two models
A photo taken at an angle and a tile looking straight down share almost nothing a model should learn from, so each view has its own. Pick the one that matches the picture.
Drone and helicopter photos, taken at an angle.
The same Nepal tile, before and after the 2017 monsoon floods.
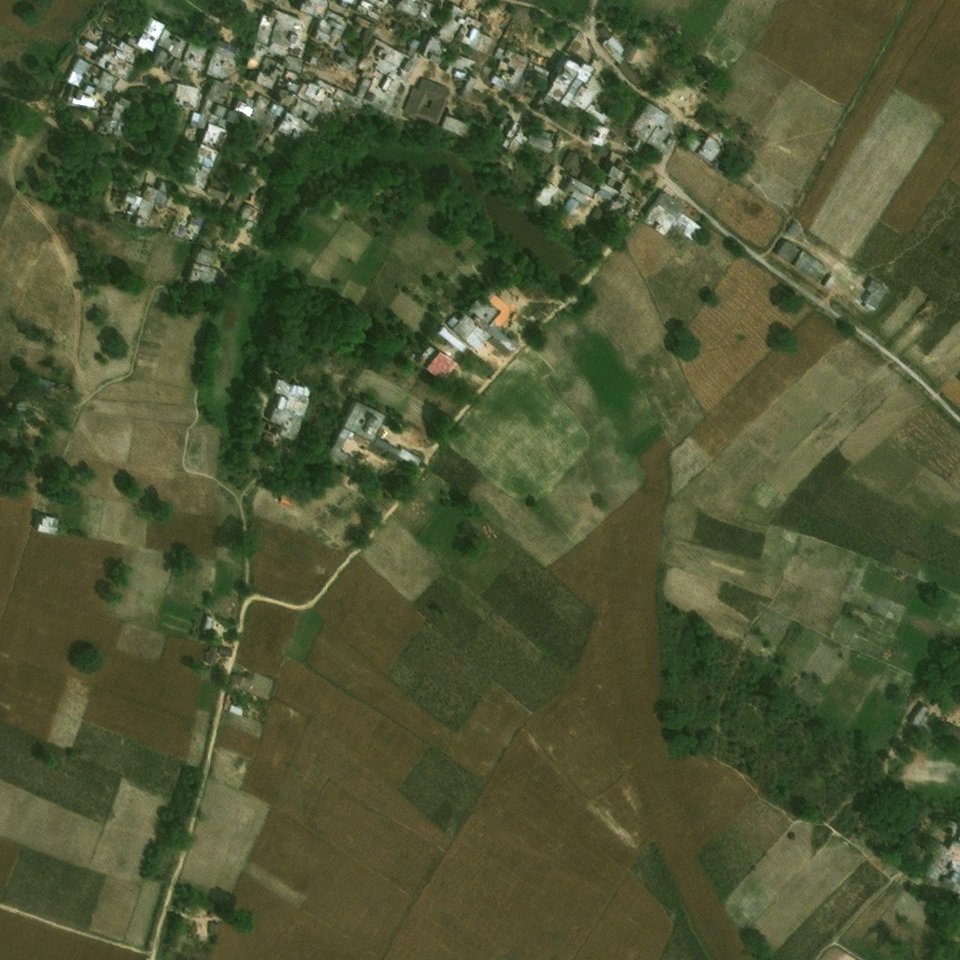
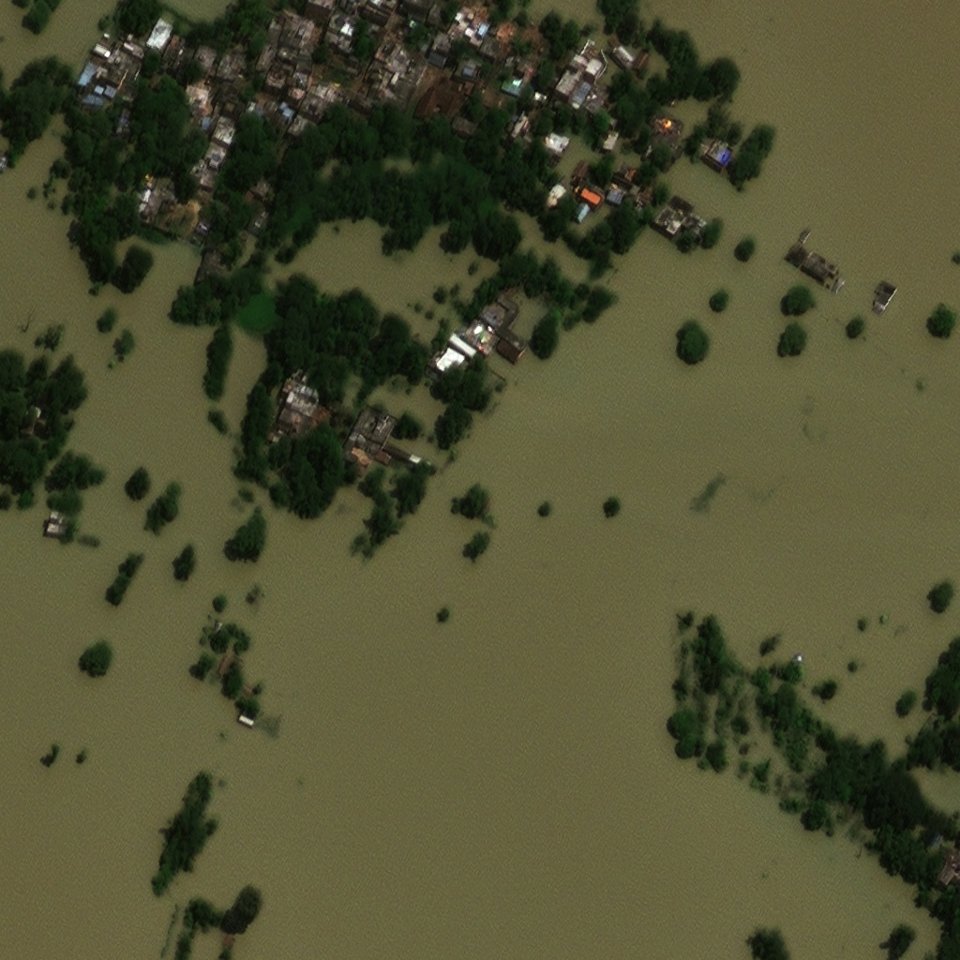
Images held out of training, scored by the running service. Sources: AIFloodSense (CC BY 4.0), AIDER, and xBD satellite imagery by Maxar (CC BY-NC-SA 4.0).
How it performs
Each model was scored once on a test set held back from the start. The harder test leaves a whole dataset or flood event out of training: the figure to expect on a new one.
Aerial · test accuracy
98.3%3,034 test images · 92.3%–99.8% on data left out of training
Satellite · test accuracy
98.0%594 test images · 70.0%–94.1% on data left out of training
| Model | Held out | Images | Accuracy |
|---|---|---|---|
| Aerial | The AIDER dataset | 6,433 | 98.8% |
| Aerial | The AIFloodSense dataset | 470 | 99.6% |
| Aerial | FloodNet, Hurricane Harvey drone photos | 2,343 | 97.8% |
| Aerial | LADI v2, Civil Air Patrol photos, 2015–2023 | 9,969 | 92.3% |
| Aerial | RescueNet, Hurricane Michael drone photos (none flooded) | 4,494 | 99.8% |
| Satellite | SpaceNet 8 tiles | 1,377 | 74.2% |
| Satellite | Germany floods, 2021 | 371 | 85.7% |
| Satellite | Hurricane Florence, 2018 | 574 | 74.4% |
| Satellite | Hurricane Harvey, 2017 | 726 | 91.5% |
| Satellite | Louisiana floods (Ida), 2021 | 1,006 | 70.0% |
| Satellite | Midwest floods, 2019 | 306 | 94.1% |
| Satellite | Nepal floods, 2017 | 1,024 | 92.1% |
| Satellite | The xBD flood tiles | 2,630 | 88.3% |
How it decides
Perception Encoder, an open vision model from Meta, reads the image and describes it as 1,536 numbers. It is used as it is, never retrained.
A small classifier, trained on 20,652 labelled images from 7 datasets, turns those numbers into the probability of a flood. Each image is read 4 times and the 4 probabilities averaged: a satellite tile, which has no up, as it is, mirrored both ways and turned a quarter; an aerial photo as it is, mirrored, cropped to its centre and tilted 7°.
Above 50% the answer is flooded. The probability travels with it, so a borderline picture can go to a person.
Know its limits
For developers
Up to 16 images a request, JPEG, PNG or WebP, as base64 or a data: URL; the answers keep their order. The key goes in X-API-Key or as a bearer token. GET /v1/tidewatch/image returns the models and these figures as JSON.
curl -X POST "$HOST/v1/tidewatch/image" \
  -H "X-API-Key: $KEY" -H "Content-Type: application/json" \
  -d '{"model": "aerial", "images": [{"data": "'"$(base64 -i photo.jpg)"'"}]}'

{"model": "aerial", "trained": "2026-11-20", "threshold": 0.5,
 "results": [{"flooded": true, "probability": 0.9996}]}
Start with your own picture
Choose an example or upload your own image, pick the view, and see the answer and its probability.